Top US Ports 2023: Challenges persist, volumes dip
The long litany of headaches now includes ongoing labor negotiations on the West Coast that could quickly shift priorities of ports in the region. While the East Coast may continue to benefit from the uncertainty, the overall forecast for volumes in 2023 remains foggy.
Over the past two years, seaports have faced dramatic challenges due to the impact of the pandemic, China’s subsequent port closures and work slowdowns, high demand for consumer goods, the Russian invasion of Ukraine, inflation, and mounting concerns of recession.
These challenges made an impact on the West Coast seaports, particularly the Ports of Los Angeles and Long Beach where they felt the influence of erratic vessel schedules and missed bookings.
“Seaports on both the West and East coasts faced the worst congestion ever since the beginning of the age of containerization,” says Stefan Verberckmoes, an analyst at ocean cargo data firm Alphaliner. “Last year, much capacity was tied up by vessels waiting to berth.”
Is your company diverting trade from West Coast ports?
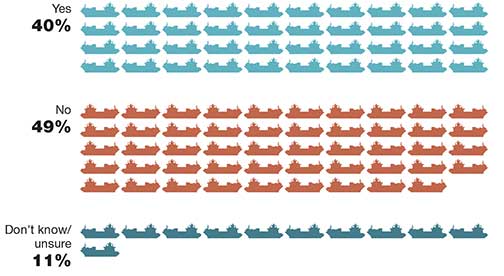
Source: CNBC Supply Chain Survey/taken late December, 2022
Dramatic shifts
Global Port Tracker, a report produced jointly by Hackett Associates and the National Retail Federation, reports that West Coast ports ended 2022 with an overall 7.5% decrease in loaded imports and an 8.6% decrease in loaded exports. Some of those decreases were due to the extremely high volumes created by the over-ordering of goods by shippers during the pandemic.
“Now, many are holding back in hopes of recovery and being cautious with the current economic situation,” says Joe Monaghan, chairman and CEO of Worldwide Logistics Group.
Adding to these decreases were concerns that International Longshore and Warehouse Union (ILWU) negotiations might shut down West Coast ports.
“Concerns of delayed or embargoed freight led shippers to change destination ports to ensure continuity of supply,” says Spencer Shute, principal consultant at supply chain consultancy Proxima. “This caused many shippers to shift volumes to the Gulf and East Coast ports to avoid delays or cargo being stuck at anchor should a strike go into effect.”
Continued labor negotiations are the focus for West Coast ports. “While the ports are pushing for more automation, the labor unions are seeking better pay and working conditions,” says Shute. He surmises that the results of the labor negotiations will determine the major priorities of the West Coast ports in 2023.
Top 30 U.S. Ports (By TEU Ocean Imports 2022)
| Rank | Port of Arrival | 2022 TEUs | 2021 TEUs | TEU Change | 2022 US$ Value | 2021 US$ Value | Value Change |
| 1 | Los Angeles, CA | 4,910,466 | 5,511,154 | -10.90 | 296,270,624,861 | 306,686,437,098 | -3.40 |
| 2 | New York-New Jersey | 4,789,976 | 4,605,291 | 4.02 | 494,155,959,932 | 352,860,304,516 | 40.05 |
| 3 | Long Beach, CA | 4,253,053 | 4,569,115 | -6.92 | 282,589,672,128 | 220,581,034,323 | 28.12 |
| 4 | Savannah, GA | 2,862,221 | 2,800,821 | 2.20 | 186,765,268,929 | 182,310,694,758 | 2.45 |
| 5 | Houston, TX | 1,896,711 | 1,642,076 | 15.51 | 259,125,939,979 | 185,571,760,151 | 39.64 |
| 6 | Norfolk, VA | 1,651,262 | 1,608,275 | 2.68 | 113,779,780,914 | 132,292,509,005 | -14.00 |
| 7 | Charleston, SC | 1,378,008 | 1,293,614 | 6.53 | 189,152,663,565 | 195,511,655,521 | -3.26 |
| 8 | Oakland, CA | 970,766 | 1,035,932 | -6.30 | 57,367,087,944 | 50,341,284,268 | 13.96 |
| 9 | Seattle, WA | 635,061 | 713,575 | -11.01 | 40,641,521,238 | 46,473,602,457 | -12.55 |
| 10 | Tacoma, WA | 609,446 | 761,899 | -20.01 | 45,505,717,863 | 51,628,898,738 | -11.86 |
| 11 | Miami, FL | 544,089 | 567,497 | -4.13 | 46,928,023,297 | 32,957,170,271 | 42.40 |
| 12 | Baltimore, MD | 502,218 | 483,384 | 3.90 | 98,823,769,180 | 60,965,195,414 | 62.10 |
| 13 | Philadelphia, PA | 453,352 | 435,287 | 4.16 | 58,075,031,740 | 59,124,946,365 | -1.78 |
| 14 | Port Everglades, FL | 385,384 | 365,137 | 5.55 | 42,485,388,549 | 38,642,408,281 | 9.95 |
| 15 | Mobile, AL | 276,063 | 256,006 | 7.84 | 57,335,401,522 | 54,261,169,713 | 5.67 |
| 16 | Jacksonville, FL | 207,519 | 205,050 | 1.21 | 33,181,845,659 | 28,676,245,293 | 15.72 |
| 17 | San Juan, PR | 198,969 | 218,280 | -8.85 | 22,188,437,728 | 27,401,951,093 | -19.03 |
| 18 | Wilmington, DE | 186,870 | 190,611 | -1.97 | 19,888,104,326 | 18,070,103,484 | 10.07 |
| 19 | Chester, PA | 138,064 | 132,281 | 4.38 | 18,703,042,232 | 13,726,806,981 | 36.26 |
| 20 | Port Hueneme, CA | 132,829 | 114,466 | 16.05 | 11,163,099,416 | 9,396,297,387 | 18.81 |
| 21 | Wilmington, NC | 116,568 | 121,499 | -4.06 | 48,397,409,948 | 42,429,447,665 | 14.07 |
| 22 | New Orleans, LA | 114,319 | 125,212 | -8.70 | 185,243,059,114 | 144,457,238,870 | 28.24 |
| 23 | Gulfport, MS | 91,738 | 85,475 | 7.33 | 5,585,355,852 | 2,405,044,849 | 132.24 |
| 24 | Tampa, FL | 91,595 | 81,651 | 12.18 | 11,203,419,891 | 6,925,050,635 | 61.79 |
| 25 | Boston, MA | 87,966 | 92,160 | -4.56 | 166,108,738,700 | 130,415,418,189 | 27.37 |
| 26 | Port Manatee, FL | 87,219 | 73,367 | 18.89 | 7,786,423,217 | 4,080,207,626 | 90.84 |
| 27 | San Diego, CA | 78,370 | 80,029 | -2.08 | 5,826,169,360 | 4,891,136,486 | 19.12 |
| 28 | Portland, OR | 62,814 | 42,238 | 48.72 | 10,472,048,753 | 8,543,397,907 | 22.58 |
| 29 | Freeport, TX (5311) | 38,762 | 31,439 | 23.30 | 6,887,849,182 | 5,215,387,805 | 32.07 |
| 30 | West Palm Beach, FL | 33,867 | 28,550 | 18.63 | 3,698,242,533 | 1,911,616,740 | 93.47 |
Caption: Source: Descartes Datamyne
Data from Descartes Datamyne indicates that West Coast ports are once again gaining market share. “In December, top West Coast ports reversed their market share decline versus top East and Gulf Coast ports,” says Chris Jones, EVP of industry and services at Descartes Datamyne.
Comparing the top five West Coast ports to the top five East and Gulf Coast ports, Descartes data shows that total import container volume at West Coast ports grew to 38.1% in December 2022, up 1.2% versus November 2022, while the East and Gulf Coast ports declined in December 2022 to 45.5%, down 1.7% versus November 2022.
“With the exception of the Port of Houston, the top East and Gulf Ports are now operating below peak volumes that started the port congestion in 2021,” says Jones says. “Returning to the top container import processing port was the Port of Los Angeles at 349,493 TEUs. The Port of New York/New Jersey fell to second at 312,763 TEUs in December 2022.”
Top 10 ports volume (May 21-September 21 versus August 22-December 22) (Top)
Monthly average delay in days at top 10 ports (Below)
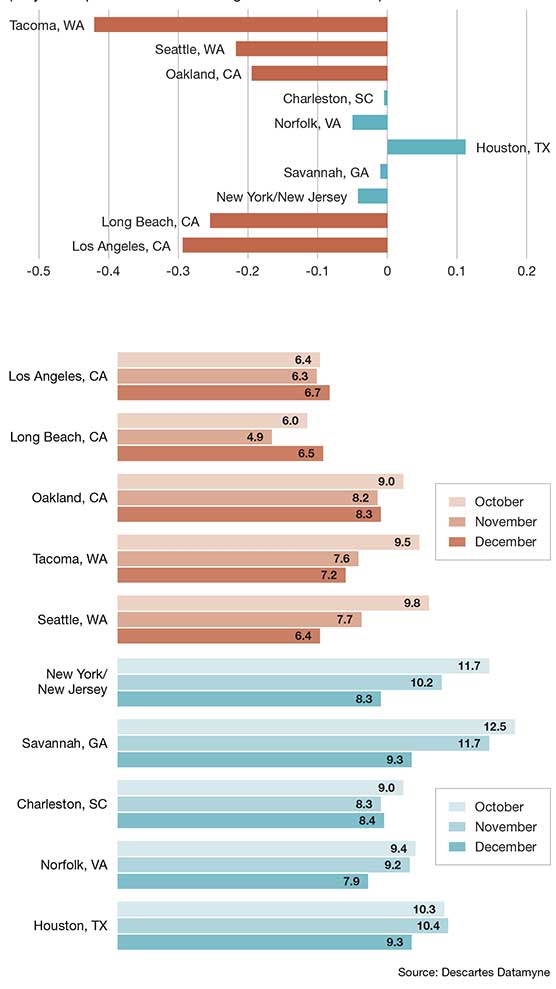
Source: Descarters Datamyne
Both Gulf and East Coast ports saw a record setting year in 2022, even with volume declines in the second half. Global Port Tracker found that at East Coast ports, import volumes remained high and exceeded 2021 levels throughout the first three quarters.
“The East Coast ended the year with a projected 3.6% increase in loaded imports and a projected 4.2% decrease in loaded exports,” says Daniel Hackett, founder and partner at Hackett Associates. “The East Coast benefited from the cargo diverted from the West Coast, shifts by shippers to diversify supply chains, and strong volumes of trans-Atlantic cargo.”
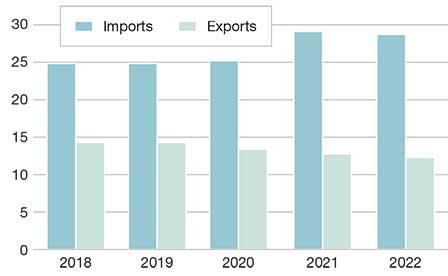
Distribution of loaded exports at primary Global Port Tracker ports by coast
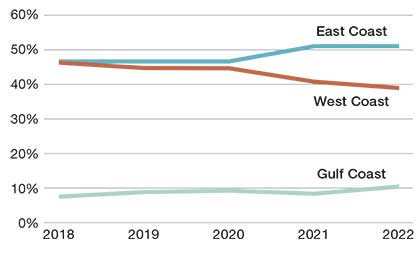
Source: Hackett Associates
Distribution of loaded imports at primary Global Port Tracker ports by coast
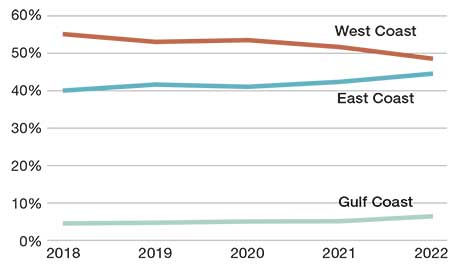
Source: Hackett Associates
Loaded TEU to primary Global Port Tracker ports (Millions of TEU)
Source: Hackett Associates
The Port of New York and New Jersey became the second largest port destination for 2022 and even surpassed Long Beach/Los Angeles for most of the second half of 2022. Nevertheless, reports indicate that 2022 volumes still marked the second busiest year on record for West Coast ports.
New York/New Jersey recorded nearly 9.5 million TEUs for 2022, the highest in its history. The Port of Los Angeles weighed in over 9.9 million TEUs, while Long Beach tallied, 9.13 million TEUs. Cargo volumes at the Port of New York and New Jersey declined in the latter half of 2022.
On the Gulf Coast, primarily Port Houston, Global Port Tracker reports that import volumes remained high throughout 2022 with double-digit percentage year-on-year growth through October. The coast ended the year with a 17.3% increase in loaded imports and an 18.7% increase in loaded exports. “Like East Coast ports, the Gulf Coast benefited from the cargo diverted from the West Coast and shifts by shippers to diversify supply chains,” says Hackett.
Overall, loaded imports at the primary ports covered by the Global Port Tracker decreased by 1.3% between 2021 and 2022 to 28.7 million TEU, while loaded exports decreased by 4.1% to 12.3 million TEUs.
“The congestion seen at West Coast ports over the past two years is no longer an issue, as import volumes declined over the second half of 2022, and the ports of Houston and Savannah, which saw congestion build up in 2022, are almost back to normal,” says Haskett. “Overall, after a 15% surge in imports in 2021, 2022 was a year of transition, with year-on-year growth in the first half followed by declines in the second half.”
Future projections
So, what do the next few years hold for port volumes? Shute predicts that West Coast ports are likely to see a return to pre-pandemic volumes. “We’ve already seen significant drops in volumes in the second half of 2022, which have continued into 2023,” he says.
For East and Gulf Coast ports, Shute expects volumes to remain at higher levels than pre-pandemic primarily, as these ports have proven to be viable options for shippers. “However, as overall demand continues to drop, total volume will also continue to fall,” he says.
Meanwhile, the outlook for the U.S. economy remains unclear. “If a recession occurs, there’s no doubt that there will be an economic downturn,” says Hackett. In the meantime, U.S. consumers continue to spend, although more on service expenditures and less on retail goods. “This will have an impact on import volumes, and this comes alongside efforts by retailers to right-size their inventories.”
Hackett Associates forecasts imports to continue to decrease in the first half of 2023 before a rebound begins in the second half of the year, although volumes are anticipated to decrease from the level seen in 2022.
Without a doubt, the ILWU labor issue, Chinese policies related to COVID, and macro-economic issues persist. “Business has proceeded as usual, with the ILWU working with management,” says Jones. “Until now, there’s been no impact on container processing as has been the case in the past.”
However, California law AB5 still remains a significant issue with no resolution in sight. There is a risk that more AB5-related stoppages could occur in other California ports in the future causing greater disruption.
“The continuing labor uncertainty could be a significant reason why import volumes are not shifting back to major California ports despite their improving situation,” adds Jones.
In fact, a recent CNBC report indicates that only a small proportion of cargo will be rerouted back to the West Coast. Of the 40% of supply chain managers who had diverted some cargo, 18% said that they would bring back 10% of their trade; 12% would bring back 20%; and 12% would bring back 60%. Most said that the main reason for diverting cargo away from the West Coast was the threat of an ILWU strike.
Source: Logistics Management